Muhlenberg College Public Health Program - 2025 Pennsylvania Health Survey
PDF: Muhlenberg College Public Health Program - 2025 Pennsylvania Health Survey
The following report examines opinions regarding public health issues in the Commonwealth of Pennsylvania in 2025. The report provides an overview of key findings from the 2025 Pennsylvania Health Survey. The survey was conducted in the Spring of 2025 by the Muhlenberg College Institute of Public Opinion (MCIPO) in conjunction with the Muhlenberg College Public Health Program.
Key Findings
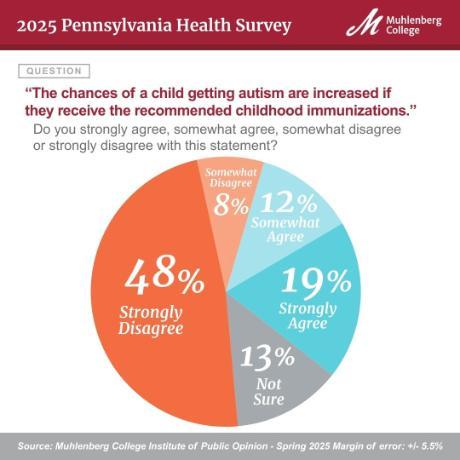
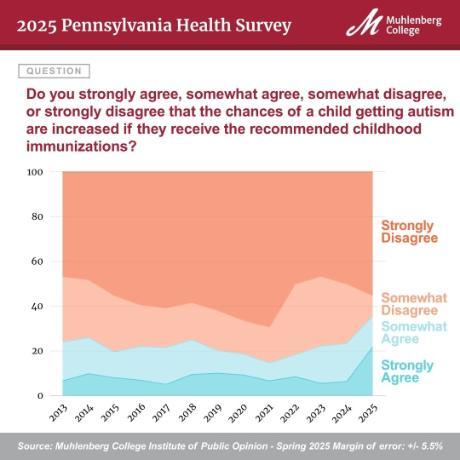
- The survey results show a notable gain in the percentage of Pennsylvanians who believe there is a link between childhood immunizations and autism, with just under 1 in 3 Commonwealth adults (31%) agreeing (“strongly” or “somewhat”) that the chances of a child getting autism are increased if they receive the recommended childhood immunizations. The 31% agreement level is the highest in the 13-year history of this survey, and marks a doubling of the percentage of Pennsylvanians that at least partially agree with the unproven immunization-autism link since 2022.
- Political party plays an important role in shaping viewpoints on the relative safety of immunizations with Republicans nearly twice as likely (41% to 21%) as Democrats to agree (“strongly” or “somewhat”) that the chances of a child getting autism are increased if they receive the recommended childhood immunizations.
- Less than 4 in 10 Pennsylvanians (36%) expressed trust (“a lot” or “some”) in Robert F. Kennedy Jr. to handle health care issues as Secretary of the Department of Health and Human Services (HHS).
- Perceptions of Kennedy appear linked to views on the relationship between immunizations and autism. Of Pennsylvanians who expressed “a lot” of trust in RFK Jr’s ability to handle health care issues as Secretary of HHS, almost half (49%) agree that the chances of autism are increased by receipt of childhood immunizations. This contrasts with those who express “no trust at all” in RFK Jr., with only 22% of this group agreeing with the claim that childhood immunizations and autism are linked.
- The 2025 Health Survey examined the impact of politics and current events as a source of stress on state residents, with the results indicating that women in Pennsylvania are almost twice as likely (42% to 22%) to report that politics and current events constitute a “major source” of stress in their lives.
- The effect of politics and current events on Keystone State residents various considerably across partisan divides with 15% of Republicans reporting that politics and current events are a “major source” of stress, compared to 52% of Democrats, and 26% of self-identified independents.
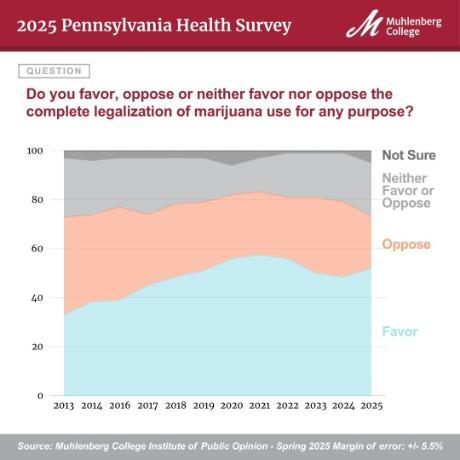
- On the issue of legalization of marijuana, the survey finds the lowest percentage of Commonwealth residents opposing legalization of this substance since the question was first asked in 2013, with only about 1 in 5 adult Pennsylvanians (21%) currently opposing the legalization of marijuana in the state.
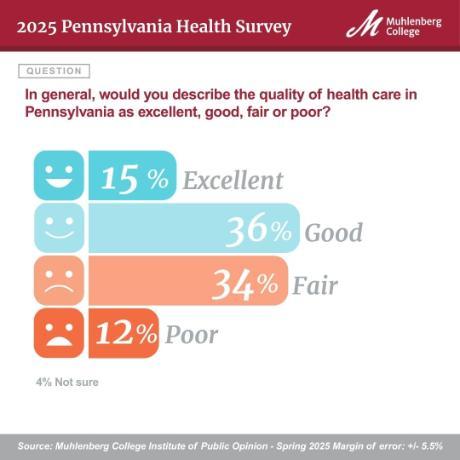
- The percent of Pennsylvanians who say that the quality of health care in the state is either “excellent” or “good” sits at 51%, down from a high of 70% in 2024. The 51% positive rating level is the lowest combined total since the MCIPO began asking the question in 2019.
- Pennsylvanians were less likely to report improved mental health in 2025 than they were in 2024. In this year’s findings 30% of state residents indicated their mental is “much better” or “somewhat better” than about a year ago, compared with 40% of state residents that reported improved mental health in 2024.
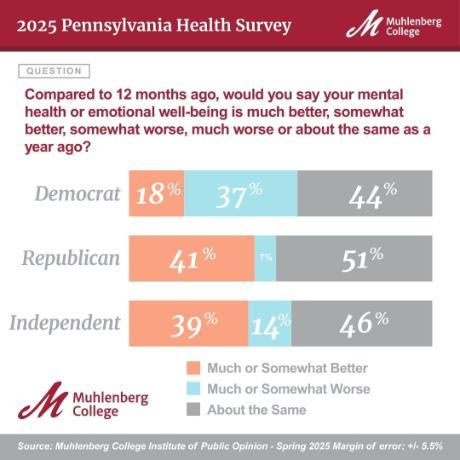
- Democrats are more likely than Republicans to indicate that their mental health or emotional well-being is “somewhat” or “much worse” than about a year ago, with 37% of Democrats in the Keystone State reporting diminished mental health over the last year compared with only 7% of their Republican counterparts.
METHODOLOGY
This report provides results of a telephone survey of 521 adult residents of the Commonwealth of Pennsylvania. Interviews were conducted between March 10 and March 26, 2025. Respondents were interviewed in English on both landlines (n=104) and cell phones (n = 417). With a randomly selected sample of respondents the margin of error for the survey is +/- 5.5% at a 95% level of confidence. Margins of error for questions with smaller sample size will be larger. In addition to sampling error, one should consider that question wording and other fielding issues can introduce error or bias into survey results. The data has been weighted to gender, age, race, and educational attainment to 2025 population parameters for the Commonwealth of Pennsylvania provided by the United States Census Bureau. The calculation of sampling error takes into account design effects due to the weighting of the sample to the population parameters identified above. In order to reach a representative sample of Pennsylvania adult residents, landlines and cell phones were called up to 3 times. Interviews were conducted by Communication Concepts of Easton Pennsylvania. Due to rounding, the totals provided in the frequency report may not total 100 percent. Data analysis and weighting were conducted through the use of the SPSS statistical software package Version 29.0. The survey instrument was designed by Dr. Christopher P. Borick, MCIPO Executive Director and Dr. Lindsay Burt, MCIPO Managing Director in conjunction with the staff of the MCIPO and Muhlenberg College Public Health Program, and is presented in its entirety in the following section of the report. The survey was funded exclusively by Muhlenberg College. For more detailed information on the methods employed please contact the MCIPO at 484-664-3444 or email Dr. Borick at [email protected].
Muhlenberg College Public Health Program
2025 Pennsylvania Health Poll
INSTRUMENT
SCREENER: Thank you. Just to confirm are you a resident of Pennsylvania who is age 18 or older?
|
1. Yes |
CONTINUE |
|
2. No |
THANK AND DISCONTINUE |
|
3. Not Sure |
THANK AND DISCONTINUE |
Q1: In general, would you describe the quality of health care in Pennsylvania as excellent, good, fair or poor?
|
1. Excellent |
15% |
|
2. Good |
36% |
|
3. Fair |
34% |
|
4. Poor |
12% |
|
98. Not Sure (Vol) |
4% |
Time Series
|
|
Spring 2019 |
Spring 2020 |
Spring 2021 |
Spring 2022 |
Spring 2023 |
Spring 2024 |
Spring 2025 |
|
Excellent |
20% |
17% |
14% |
13% |
21% |
16% |
15% |
|
Good |
47% |
42% |
48% |
42% |
45% |
54% |
36% |
|
Fair |
25% |
24% |
23% |
30% |
25% |
22% |
34% |
|
Poor |
5% |
16% |
12% |
12% |
7% |
8% |
12% |
|
Not Sure |
3% |
<1% |
4% |
3% |
1% |
1% |
4% |
Q2: In general, would you describe the health care YOU have received in the last year as excellent, good, fair or poor?
|
1. Excellent |
29% |
|
2. Good |
41% |
|
3. Fair |
22% |
|
4. Poor |
4% |
|
5. Did not receive any health care in the last year (Vol) |
3% |
|
98. Not Sure (Vol) |
1% |
Time Series
|
|
Spring 2023 |
Spring 2024 |
Spring 2025 |
|
Excellent |
29% |
32% |
29% |
|
Good |
48% |
51% |
41% |
|
Fair |
18% |
13% |
22% |
|
Poor |
5% |
4% |
4% |
|
Not Sure |
<1% |
<1% |
1% |
Q3: In your opinion, what is the greatest threat to public health in Pennsylvania today? (OPEN ENDED)
|
Access to/cost of healthcare |
23% |
|
President Trump/Republicans/RFK Jr. |
13% |
|
Corporate actors/pharmaceutical companies |
6% |
|
Specific health conditions (i.e. cancer, bird flu) |
5% |
|
Misinformation, scientific skepticism, or lack of trust |
4% |
|
Recent policy shifts |
4% |
|
Democrats |
3% |
|
Environmental factors |
3% |
|
Economy/poverty |
2% |
|
Individual behaviors |
2% |
|
PA State government |
<1% |
|
Other |
13% |
|
Not sure/no response |
23% |
Q4: In the past year, have you or someone in your household had difficulty accessing health care due to cost?
|
1. Yes |
26% |
|
2. No |
72% |
|
3. Did not receive any health care in the last year (Vol) |
1% |
|
98. Not Sure (Vol) |
1% |
Q5: Would you say that your ability to access a variety of healthy food options in your community is excellent, good, fair or poor?
|
1. Excellent |
27% |
|
2. Good |
38% |
|
3. Fair |
26% |
|
4. Poor |
10% |
|
98. Not Sure (Vol) |
1% |
Q6: Next, I would like to ask you a question about marijuana. First, do you favor, oppose or neither favor nor oppose the complete legalization of the use of marijuana for any purpose?
|
1. Favor |
52% |
|
2. Oppose |
21% |
|
3. Neither Favor or Oppose |
22% |
|
98. Not Sure (Vol) |
5% |
Time Series
|
|
Spring 2013 |
Spring 2014 |
Spring 2016 |
Spring 2017 |
Spring 2018 |
Spring 2019 |
Spring 2020 |
Spring 2021 |
Spring 2022 |
Spring 2023 |
Spring 2024 |
Spring 2025 |
|
Favor |
33% |
38% |
39% |
45% |
49% |
51% |
56% |
58% |
56% |
50% |
49% |
52% |
|
Oppose |
40% |
35% |
38% |
29% |
30% |
28% |
26% |
26% |
25% |
31% |
31% |
21% |
|
Neither Favor or Oppose |
24% |
22% |
20% |
23% |
19% |
18% |
12% |
14% |
18% |
18% |
20% |
22% |
|
Not Sure |
3% |
4% |
3% |
3% |
3% |
3% |
6% |
3% |
1% |
<1% |
<1% |
5% |
Q7: Next, I have a few questions about mental health. How would you describe your own mental health or emotional well-being at this time? Would you say it is -- excellent, good, only fair, or poor?
|
1. Excellent |
26% |
|
2. Good |
50% |
|
3. Only Fair |
16% |
|
4. Poor |
8% |
|
98. Not Sure (Vol) |
1% |
Time Series
|
|
Spring 2021 |
Spring 2022 |
Spring 2023 |
Spring 2024 |
Spring 2025 |
|
Excellent |
33% |
35% |
25% |
32% |
26% |
|
Good |
45% |
44% |
53% |
51% |
50% |
|
Fair |
19% |
17% |
17% |
14% |
16% |
|
Poor |
3% |
4% |
4% |
3% |
8% |
|
Not Sure (Vol) |
1% |
<1% |
0% |
0% |
1% |
Q8: Compared to 12 months ago, would you say your mental health or emotional well-being is much better, somewhat better, somewhat worse, much worse or about the same as a year ago?
|
1. Much Better |
15% |
|
2. Somewhat Better |
15% |
|
3. Somewhat Worse |
15% |
|
4. Much Worse |
6% |
|
5. About the Same as a Year Ago |
48% |
|
98. Not Sure (Vol) |
1% |
Time Series
|
|
Spring 2021 |
Spring 2022 |
Spring 2023 |
Spring 2024 |
Spring 2025 |
|
Much Better |
9% |
12% |
10% |
13% |
15% |
|
Somewhat Better |
17% |
19% |
26% |
27% |
15% |
|
Somewhat Worse |
18% |
9% |
10% |
6% |
15% |
|
Much Worse |
4% |
3% |
3% |
3% |
6% |
|
About the Same as a Year Ago |
53% |
56% |
51% |
52% |
48% |
|
Not Sure |
<1% |
0% |
0% |
0% |
1% |
Q9: Are politics and current events a major source of stress, a minor source of stress, or not a source of stress for you?
|
1. Major Source |
32% |
|
2. Minor Source |
35% |
|
3. Not a Source |
31% |
|
98. Not Sure (Vol) |
2% |
Q10: Please indicate if you strongly agree, somewhat agree, somewhat disagree or strongly disagree with the following statements. First, the chances of a child getting autism are increased if they receive the recommended childhood immunizations. (ROTATE OPTIONS Q10 to Q15)
|
1. Strongly Agree |
19% |
|
2. Somewhat Agree |
12% |
|
3. Somewhat Disagree |
8% |
|
4. Strongly Disagree |
48% |
|
98. Not Sure (Vol) |
13% |
Time Series
|
|
Spring 2013 |
Spring 2014 |
Spring 2015 |
Spring 2016 |
Spring 2017 |
Spring 2018 |
Spring 2019 |
Spring 2020 |
Spring 2021 |
Spring 2022 |
Spring 2023 |
Spring 2024 |
Spring 2025 |
|
Strongly Agree |
5% |
8% |
7% |
6% |
4% |
8% |
9% |
8% |
5% |
7% |
5% |
6% |
19% |
|
Somewhat Agree |
13% |
13% |
10% |
13% |
13% |
13% |
9% |
8% |
6% |
8% |
15% |
16% |
12% |
|
Somewhat Disagree |
22% |
21% |
22% |
16% |
14% |
14% |
16% |
13% |
12% |
26% |
28% |
25% |
8% |
|
Strongly Disagree |
35% |
39% |
48% |
51% |
48% |
49% |
55% |
57% |
52% |
41% |
42% |
47% |
48% |
|
Not Sure |
26% |
19% |
12% |
14% |
21% |
16% |
11% |
15% |
25% |
18% |
11% |
6% |
13% |
Q11: Immunizations pose little health risks to those that receive them.
|
1. Strongly Agree |
43% |
|
2. Somewhat Agree |
21% |
|
3. Somewhat Disagree |
12% |
|
4. Strongly Disagree |
16% |
|
98. Not Sure (Vol) |
9% |
Time Series
|
|
Spring 2019 |
Spring 2020 |
Spring 2021 |
Spring 2022 |
Spring 2023 |
Spring 2024 |
Spring 2025 |
|
Strongly Agree |
54% |
49% |
41% |
41% |
41% |
40% |
43% |
|
Somewhat Agree |
23% |
25% |
30% |
34% |
40% |
36% |
21% |
|
Somewhat Disagree |
9% |
8% |
9% |
12% |
15% |
15% |
12% |
|
Strongly Disagree |
9% |
8% |
3% |
10% |
3% |
9% |
16% |
|
Not Sure |
4% |
10% |
17% |
4% |
2% |
1% |
9% |
Q12: Childhood vaccinations should be required for school enrollment, excepting only those with medical exemptions.
|
1. Strongly Agree |
61% |
|
2. Somewhat Agree |
18% |
|
3. Somewhat Disagree |
7% |
|
4. Strongly Disagree |
10% |
|
98. Not Sure (Vol) |
4% |
Q13: Access to abortions should be more limited in Pennsylvania
|
1. Strongly Agree |
19% |
|
2. Somewhat Agree |
10% |
|
3. Somewhat Disagree |
12% |
|
4. Strongly Disagree |
50% |
|
98. Not Sure (Vol) |
9% |
Q14: President Trump’s Executive Order withdrawing the United States from the World Health Organization was in the best interest of the health of American citizens.
|
1. Strongly Agree |
25% |
|
2. Somewhat Agree |
12% |
|
3. Somewhat Disagree |
5% |
|
4. Strongly Disagree |
49% |
|
98. Not Sure (Vol) |
10% |
Q15: The United States withdrawal from the World Health organization will negatively impact US preparedness for the next pandemic.
|
1. Strongly Agree |
47% |
|
2. Somewhat Agree |
10% |
|
3. Somewhat Disagree |
11% |
|
4. Strongly Disagree |
21% |
|
98. Not Sure (Vol) |
11% |
Q16. How much trust do you have in Robert Kennedy Jr. to handle health care issues as Secretary of Health and Human Services?
|
A lot of trust |
19% |
|
Some trust |
17% |
|
Not too much trust |
11% |
|
No trust at all |
40% |
|
Not sure (Vol) |
13% |
Next, I’m going to read a list of issues in Pennsylvania today. For each issue I mention please indicate if you think the issue is a crisis, a problem but not a crisis, or not a problem at all. First: (ROTATE QUESTIONS 19-23)
Q17: Fracking
|
1. Crisis |
12% |
|
2. A problem but not a crisis |
34% |
|
3. Not a problem |
39% |
|
98. Not sure (Vol) |
15% |
Q18: Climate change
|
1. Crisis |
39% |
|
2. A problem but not a crisis |
30% |
|
3. Not a problem |
28% |
|
98. Not sure (Vol) |
3% |
Time Series
|
|
Spring 2023 |
Spring 2024 |
Spring 2025 |
|
Crisis |
29% |
31% |
39% |
|
A problem but not a crisis |
38% |
46% |
30% |
|
Not a problem |
28% |
23% |
28% |
|
Not Sure |
4% |
<1% |
3% |
Q19: Obesity
|
1. Crisis |
46% |
|
2. A problem but not a crisis |
45% |
|
3. Not a problem |
6% |
|
98. Not sure (Vol) |
3% |
Q20: Domestic Violence
|
1. Crisis |
39% |
|
2. A problem but not a crisis |
52% |
|
3. Not a problem |
4% |
|
98. Not sure (Vol) |
5% |
DEMOGRAPHICS
Q27. Finally, I have a few questions about yourself. First, what is your current marital status?
|
|
|
|
Single |
30% |
|
Married |
50% |
|
Separated |
3% |
|
Divorced |
7% |
|
Widowed |
6% |
|
Partnered |
2% |
|
Not Sure (Vol) |
2% |
Q28. What is your highest level of education? Is it (READ LIST)?
|
|
|
|
Less Than High School |
2% |
|
High School Graduate |
30% |
|
Some College Or Technical School |
26% |
|
College Graduate (4 Yr Only) |
27% |
|
Graduate Or Professional Degree |
15% |
|
Not Sure (Vol) |
1% |
Q29. Which of the following categories best describes your racial identity? (READ LIST)
|
|
|
|
White/Caucasian |
72% |
|
Black/African-American |
11% |
|
Hispanic or Latino |
7% |
|
Asian |
3% |
|
Native American |
1% |
|
Mixed Race |
2% |
|
Or Other |
3% |
|
Not Sure (Vol) |
1% |
Q30: Which of the following categories best describes your current voting status? Are you registered as a (READ LIST)?
|
|
|
|
Democrat |
43% |
|
Republican |
40% |
|
Independent |
14% |
|
Other Party |
2% |
|
Or Not Registered To Vote In Pennsylvania |
2% |
|
Not Sure (Vol) |
1% |
Q31. Which of the following categories best describes your religious affiliation? Are you (READ LIST)?
|
|
|
|
Catholic |
28% |
|
Protestant |
26% |
|
Jewish |
2% |
|
Muslim |
2% |
|
Hindu |
<1% |
|
Other Religion (Including Agnostic) |
28% |
|
Atheist |
8% |
|
Not Sure (Vol) |
6% |
Q32. Do you have children under the age of 18?
|
|
|
|
Has Children Under 18 |
21% |
|
No Children Under 18 |
79% |
Q33: Which of the following best describes your health care insurance status? Are you primarily insured:
|
|
|
|
By A Plan Provided By Your Employer |
50% |
|
By A Plan That You Purchase Individually |
8% |
|
By Medicaid Coverage |
8% |
|
By Medicare Coverage |
23% |
|
Uninsured |
3% |
|
Other |
6% |
|
Not Sure (Vol) |
2% |
Q34: In which of the following age categories does your current age fall? READ LIST
|
|
|
|
18-29 |
22% |
|
30-49 |
28% |
|
50-65 |
26% |
|
Or Over 65 |
24% |
Q35. Which of the following best describes your family income? (READ LIST)?
|
|
|
|
Under $20,000 |
10% |
|
$20,000-$40,000 |
19% |
|
$40,000-$60,000 |
13% |
|
$60,000-$80,000 |
13% |
|
$80,000-$100,000 |
12% |
|
Over $100,000 |
24% |
|
Not Sure (Vol) |
9% |
Q36: Finally, to which gender identity do you most identify? (READ LIST)
|
|
|
|
Female |
50% |
|
Male |
49% |
|
Transgender Male |
0% |
|
Transgender Female |
<1% |
|
Or you do not identify as male, female or transgender |
<1% |
|
Not Sure (Vol) |
1% |
Selected Cross Tabulations
Q6: Next, I would like to ask you a question about marijuana. First, do you favor, oppose, or neither favor nor oppose the complete legalization of the use of marijuana for any purpose?
|
|
Favor |
Oppose |
Neither Favor Nor Oppose |
|
Female |
49% |
23% |
22% |
|
Male |
55% |
19% |
23% |
|
No College Degree |
52% |
18% |
23% |
|
College Degree |
51% |
27% |
20% |
|
White |
54% |
18% |
22% |
|
Person of Color |
47% |
29% |
22% |
|
Catholic |
52% |
25% |
19% |
|
Protestant |
44% |
25% |
24% |
|
Non-Christian/No Religion |
54% |
18% |
22% |
|
Democrat |
64% |
13% |
19% |
|
Republican |
39% |
31% |
23% |
|
Independent |
51% |
18% |
28% |
|
18-29 |
56% |
18% |
20% |
|
30-49 |
57% |
17% |
23% |
|
50-65 |
49% |
23% |
23% |
|
Over 65 |
44% |
27% |
22% |
|
Under 60K Income |
52% |
19% |
25% |
|
Over 60K Income |
53% |
22% |
20% |
Q8: Compared to 12 months ago, would you say your mental health or emotional well-being is much better, somewhat better, somewhat worse, much worse, or about the same as a year ago?
|
|
Much Better |
Somewhat Better |
Somewhat Worse |
Much Worse |
About the Same |
|
Female |
18% |
11% |
18% |
7% |
44% |
|
Male |
12% |
18% |
13% |
4% |
53% |
|
No College Degree |
16% |
15% |
13% |
6% |
49% |
|
College Degree |
15% |
14% |
19% |
6% |
47% |
|
White |
14% |
15% |
14% |
7% |
49% |
|
Person of Color |
18% |
15% |
18% |
4% |
44% |
|
Catholic |
18% |
16% |
12% |
4% |
51% |
|
Protestant |
13% |
13% |
16% |
3% |
53% |
|
Non-Christian/No Religion |
16% |
15% |
16% |
9% |
43% |
|
Democrat |
7% |
11% |
26% |
11% |
44% |
|
Republican |
23% |
18% |
5% |
2% |
51% |
|
Independent |
20% |
19% |
13% |
1% |
46% |
|
18-29 |
20% |
24% |
9% |
4% |
42% |
|
30-49 |
15% |
15% |
15% |
9% |
46% |
|
50-65 |
14% |
11% |
23% |
6% |
46% |
|
Over 65 |
12% |
10% |
14% |
5% |
57% |
|
Under 60K Income |
16% |
13% |
12% |
10% |
46% |
|
Over 60K Income |
15% |
17% |
19% |
3% |
46% |
Q9: Are politics and current events a major source of stress, a minor source of stress, or not a source of stress for you?
|
|
Major Source |
Minor Source |
Not a Source |
|
Female |
42% |
29% |
27% |
|
Male |
22% |
42% |
35% |
|
No College Degree |
28% |
33% |
37% |
|
College Degree |
38% |
39% |
21% |
|
White |
34% |
33% |
31% |
|
Person of Color |
29% |
40% |
29% |
|
Catholic |
28% |
36% |
35% |
|
Protestant |
25% |
40% |
34% |
|
Non-Christian/No Religion |
41% |
33% |
23% |
|
Democrat |
52% |
28% |
18% |
|
Republican |
15% |
41% |
42% |
|
Independent |
26% |
43% |
27% |
|
18-29 |
27% |
50% |
22% |
|
30-49 |
35% |
34% |
29% |
|
50-65 |
36% |
28% |
37% |
|
Over 65 |
30% |
30% |
34% |
|
Under 60K Income |
31% |
30% |
37% |
|
Over 60K Income |
33% |
41% |
26% |
Q10: Please indicate if you strongly agree, somewhat agree, somewhat disagree, or strongly disagree with the following statements: first, the chances of a child getting autism are increased if they receive the recommended childhood immunizations.
|
|
Strongly Agree |
Somewhat Agree |
Somewhat Disagree |
Strongly Disagree |
|
Female |
17% |
10% |
10% |
52% |
|
Male |
21% |
13% |
7% |
45% |
|
No College Degree |
18% |
16% |
9% |
43% |
|
College Degree |
20% |
6% |
8% |
54% |
|
White |
18% |
9% |
9% |
51% |
|
Person of Color |
22% |
18% |
7% |
40% |
|
Catholic |
22% |
15% |
11% |
39% |
|
Protestant |
15% |
10% |
10% |
48% |
|
Non-Christian/No Religion |
19% |
9% |
5% |
55% |
|
Democrat |
14% |
7% |
8% |
64% |
|
Republican |
23% |
18% |
11% |
32% |
|
Independent |
25% |
11% |
1% |
44% |
|
18-29 |
12% |
13% |
5% |
62% |
|
30-49 |
17% |
15% |
10% |
44% |
|
50-65 |
25% |
9% |
9% |
46% |
|
Over 65 |
22% |
9% |
8% |
44% |
|
Under 60K Income |
20% |
13% |
9% |
44% |
|
Over 60K Income |
18% |
11% |
9% |
53% |
Q11: Immunizations pose little health risks to those that receive them.
|
|
Strongly Agree |
Somewhat Agree |
Somewhat Disagree |
Strongly Disagree |
|
Female |
46% |
20% |
10% |
16% |
|
Male |
40% |
21% |
14% |
16% |
|
No College Degree |
39% |
24% |
10% |
16% |
|
College Degree |
48% |
16% |
14% |
15% |
|
White |
47% |
18% |
12% |
16% |
|
Person of Color |
34% |
28% |
11% |
14% |
|
Catholic |
39% |
19% |
17% |
16% |
|
Protestant |
45% |
18% |
12% |
15% |
|
Non-Christian/No Religion |
45% |
25% |
8% |
15% |
|
Democrat |
58% |
15% |
7% |
15% |
|
Republican |
27% |
26% |
18% |
19% |
|
Independent |
45% |
23% |
6% |
7% |
|
18-29 |
38% |
31% |
19% |
9% |
|
30-49 |
45% |
22% |
10% |
15% |
|
50-65 |
44% |
17% |
10% |
16% |
|
Over 65 |
44% |
13% |
8% |
23% |
|
Under 60K Income |
38% |
24% |
11% |
18% |
|
Over 60K Income |
48% |
17% |
12% |
13% |
Q16: How much trust do you have in Robert Kennedy Jr. to handle health care issues as Secretary of Health and Human Services?
|
|
A lot of trust |
Some trust |
Not too much trust |
No trust at all |
|
Female |
17% |
13% |
9% |
46% |
|
Male |
22% |
20% |
13% |
34% |
|
No College Degree |
23% |
17% |
10% |
35% |
|
College Degree |
14% |
17% |
12% |
48% |
|
White |
23% |
15% |
11% |
39% |
|
Person of Color |
10% |
20% |
13% |
42% |
|
Catholic |
25% |
20% |
14% |
34% |
|
Protestant |
19% |
16% |
12% |
38% |
|
Non-Christian/No Religion |
17% |
13% |
9% |
44% |
|
Democrat |
4% |
10% |
10% |
70% |
|
Republican |
35% |
26% |
10% |
11% |
|
Independent |
22% |
15% |
16% |
38% |
|
18-29 |
12% |
17% |
19% |
33% |
|
30-49 |
19% |
20% |
9% |
39% |
|
50-65 |
20% |
17% |
10% |
41% |
|
Over 65 |
25% |
12% |
6% |
47% |
|
Under 60K Income |
19% |
16% |
10% |
40% |
|
Over 60K Income |
18% |
18% |
13% |
42% |
How much trust do you have in Robert Kennedy Jr. to handle health care issues as Secretary of Health and Human Services? X Level of agreement: the chances of a child getting autism are increased if they receive the recommended childhood immunizations.
|
|
Strongly Agree |
Somewhat Agree |
Somewhat Disagree |
Strongly Disagree |
|
A lot of trust |
32% |
17% |
9% |
25% |
|
Some trust |
20% |
21% |
8% |
33% |
|
Not too much trust |
9% |
7% |
13% |
61% |
|
No trust at all |
15% |
7% |
7% |
63% |
How much trust do you have in Robert Kennedy Jr. to handle health care issues as Secretary of Health and Human Services? X Immunizations pose little health risks to those that receive them.
|
|
Strongly Agree |
Somewhat Agree |
Somewhat Disagree |
Strongly Disagree |
|
A lot of trust |
27% |
24% |
14% |
22% |
|
Some trust |
29% |
24% |
20% |
17% |
|
Not too much trust |
46% |
33% |
9% |
5% |
|
No trust at all |
60% |
16% |
8% |
12% |
Which of the following best describes your current voting status? Are you registered as a: X President Trump’s Executive Order withdrawing the United States from the World Health Organization was in the best interest of the health of American citizens.
|
|
Strongly Agree |
Somewhat Agree |
Somewhat Disagree |
Strongly Disagree |
|
Democrat |
8% |
2% |
4% |
81% |
|
Republican |
46% |
20% |
5% |
16% |
|
Independent |
18% |
20% |
3% |
45% |
Which of the following best describes your current voting status? Are you registered as a: X The United States withdrawal from the World Health Organization will negatively impact US preparedness for the next pandemic.
|
|
Strongly Agree |
Somewhat Agree |
Somewhat Disagree |
Strongly Disagree |
|
Democrat |
72% |
13% |
4% |
5% |
|
Republican |
19% |
9% |
18% |
42% |
|
Independent |
47% |
7% |
13% |
16% |