Skip to Main Content

Muhlenberg College
  • Visit
  • Apply
  • Request Info
  • Give
Menu
  • Home
  • Who We Are
  • College Offices
  • Institutional Effectiveness and Analytics
  • Quick Facts

Quick Facts

  • Academic Program Goals
  • Accreditation
  • Assessment
  • College Navigator
  • College Scorecard
  • Common Data Set
  • Conducting Research on Campus
  • Consumer Information
  • IR Links
  • Mission and Goals
  • National Surveys
  • Outcomes
  • Quick Facts
  • Source Book
  • Home
  • Who We Are
  • College Offices
  • Institutional Effectiveness and Analytics
  • Quick Facts

Quick facts are designed to help users quickly locate data on student enrollment and retention, faculty and staff size and financial aid and costs. Click or tab on the interactive menus below to view the data.

Enrollment

Student summer study enrollments 2018-2022.

Fall 2021 day student enrollment by race & ethnicity.

Pie chart showcasing major fields of study. Theatre and Psychology have the largest enrollment.

Fall 2021 day student enrollment, percentages by religious affiliation.

Student away semester locations by continent in Fall 2021.

Table displaying day college enrollments from Fall 2017 - Fall 2021.

Bar chart showcasing student enrollment for the day college.

Fall 2021 day student enrollment by state of permanent residence.

21-22 bar chart depicting School of Continuing Education Liberal Arts Program.


Faculty and Staff

Chart of employee census by employment status and classification.

Chart showcasing day college faculty demographics by sex, employment status and rank.

Retention, Graduation Rates and Plans after Graduation

Chart showcasing graduation rates by class year, 2014-2021.

2021-2022 chart showcasing summary of career plans by percentage and graduation year.

Chart showcasing retention rates by class year, 2017-2021.

Student Costs/Financial Aid

Chart showcasing student costs by year, 2017-2022.

In 2021-2022, the financial aid awarded per student covered an average of 76.7% of the college's tuition & fees.

Line graph showcasing total student financial aid awarded as percent of tuition & fees.

Line chart depicting tuition & fees by academic year, 2017-2022.

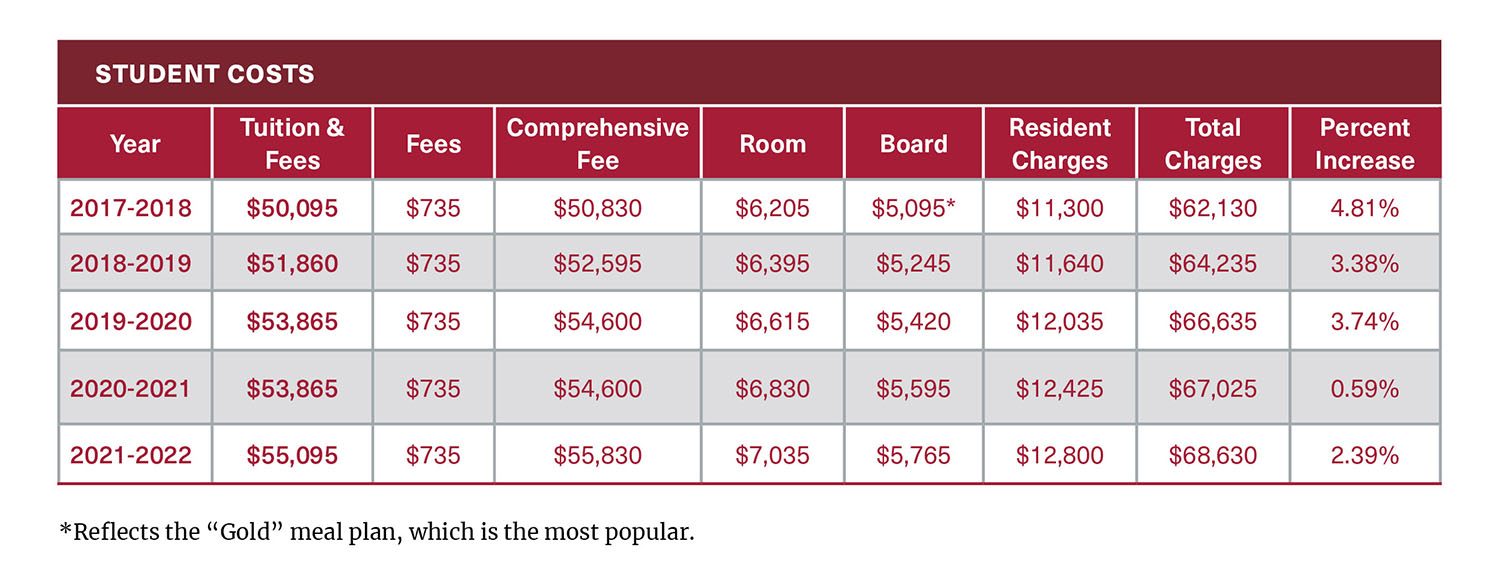
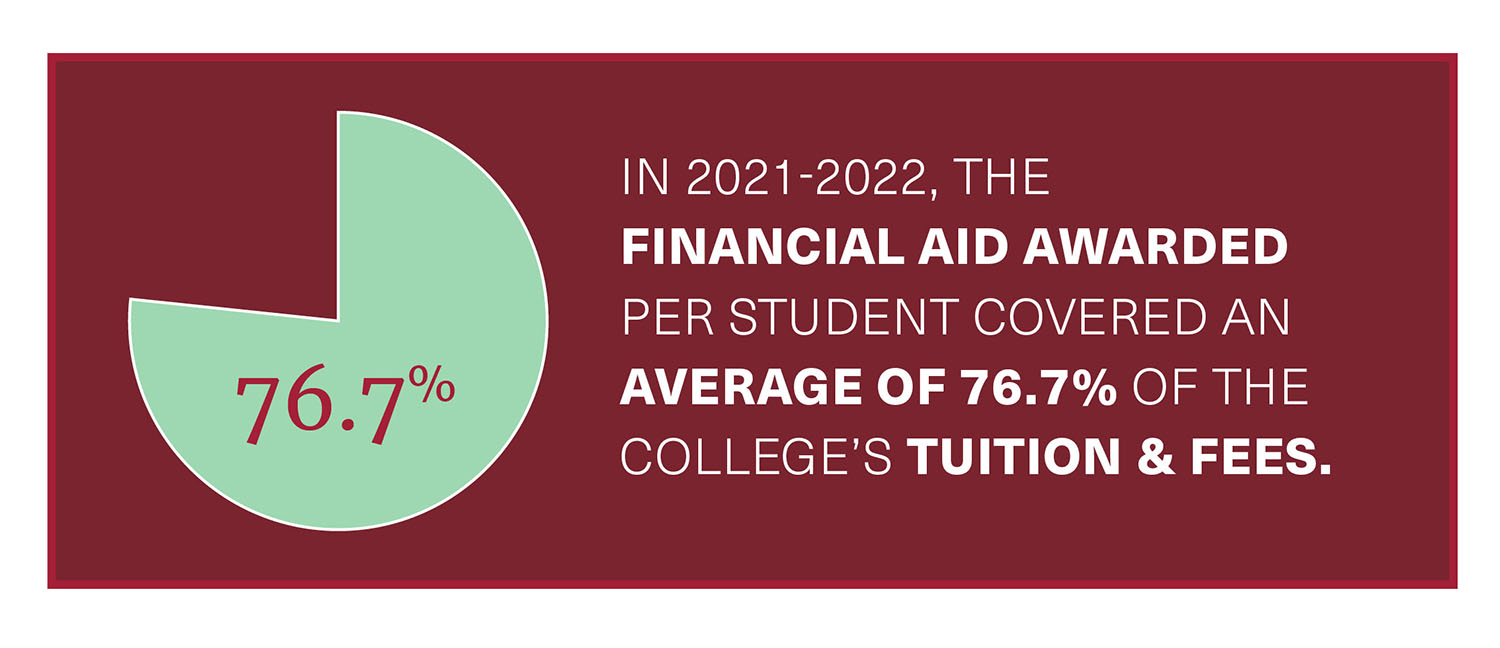
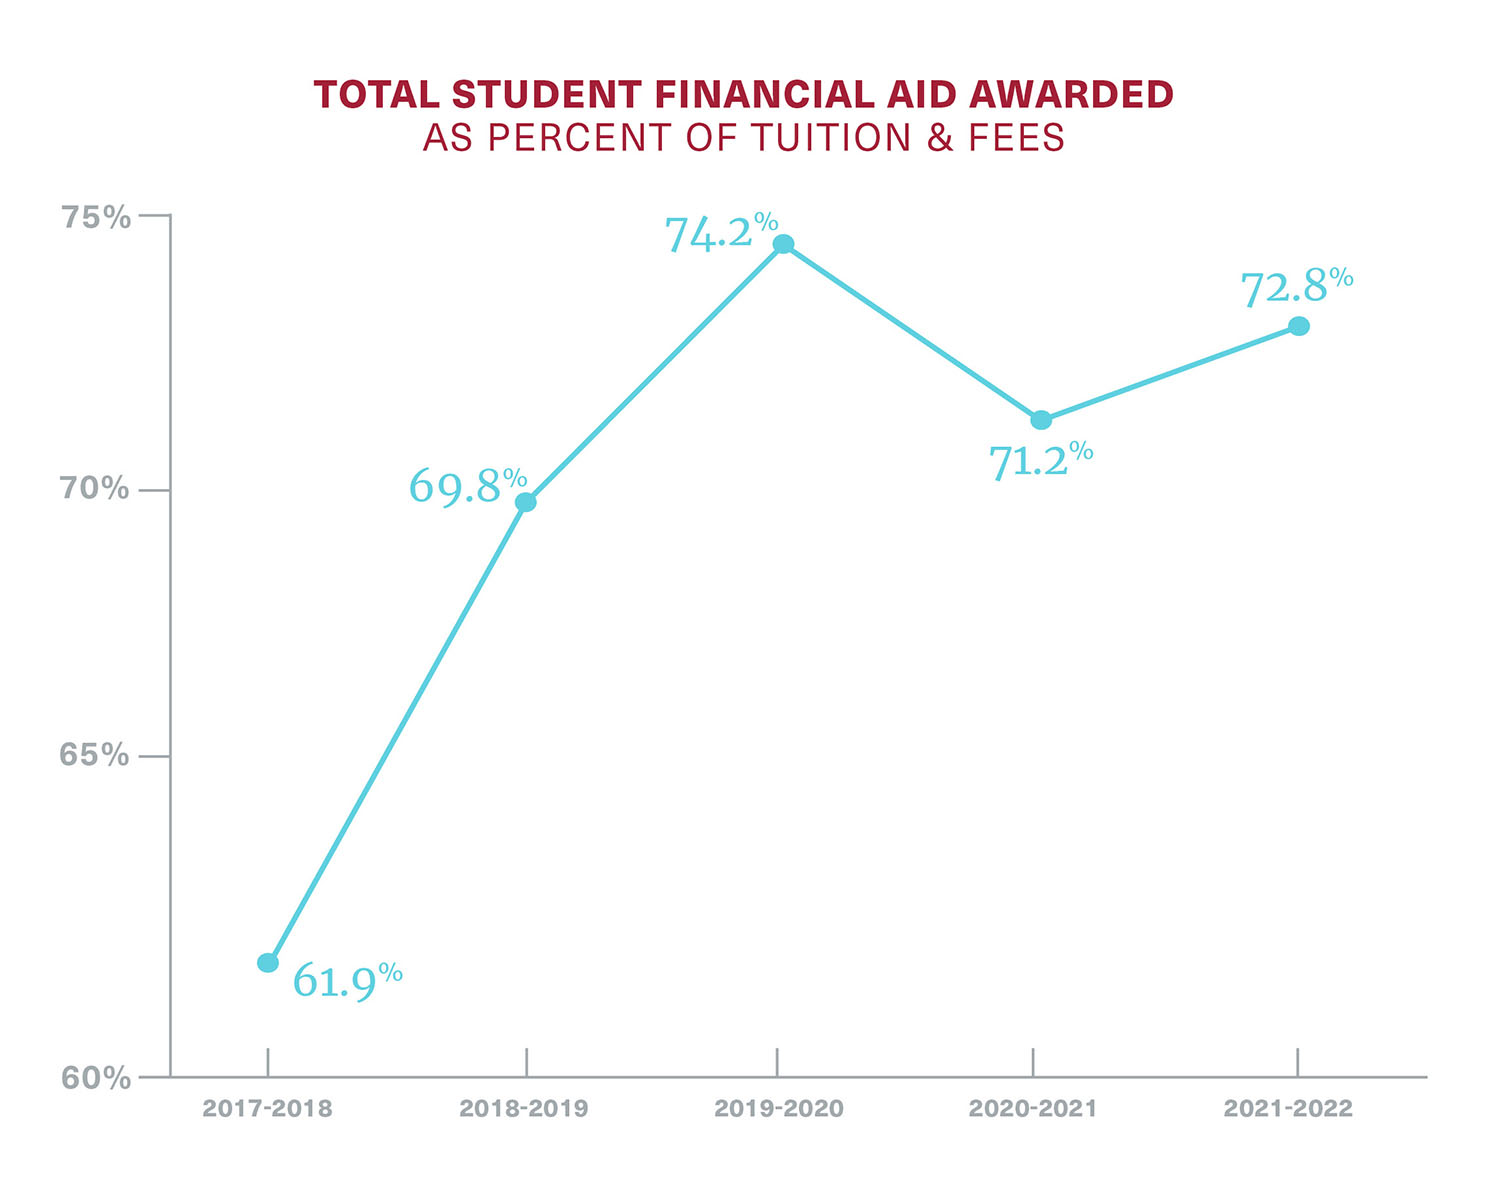
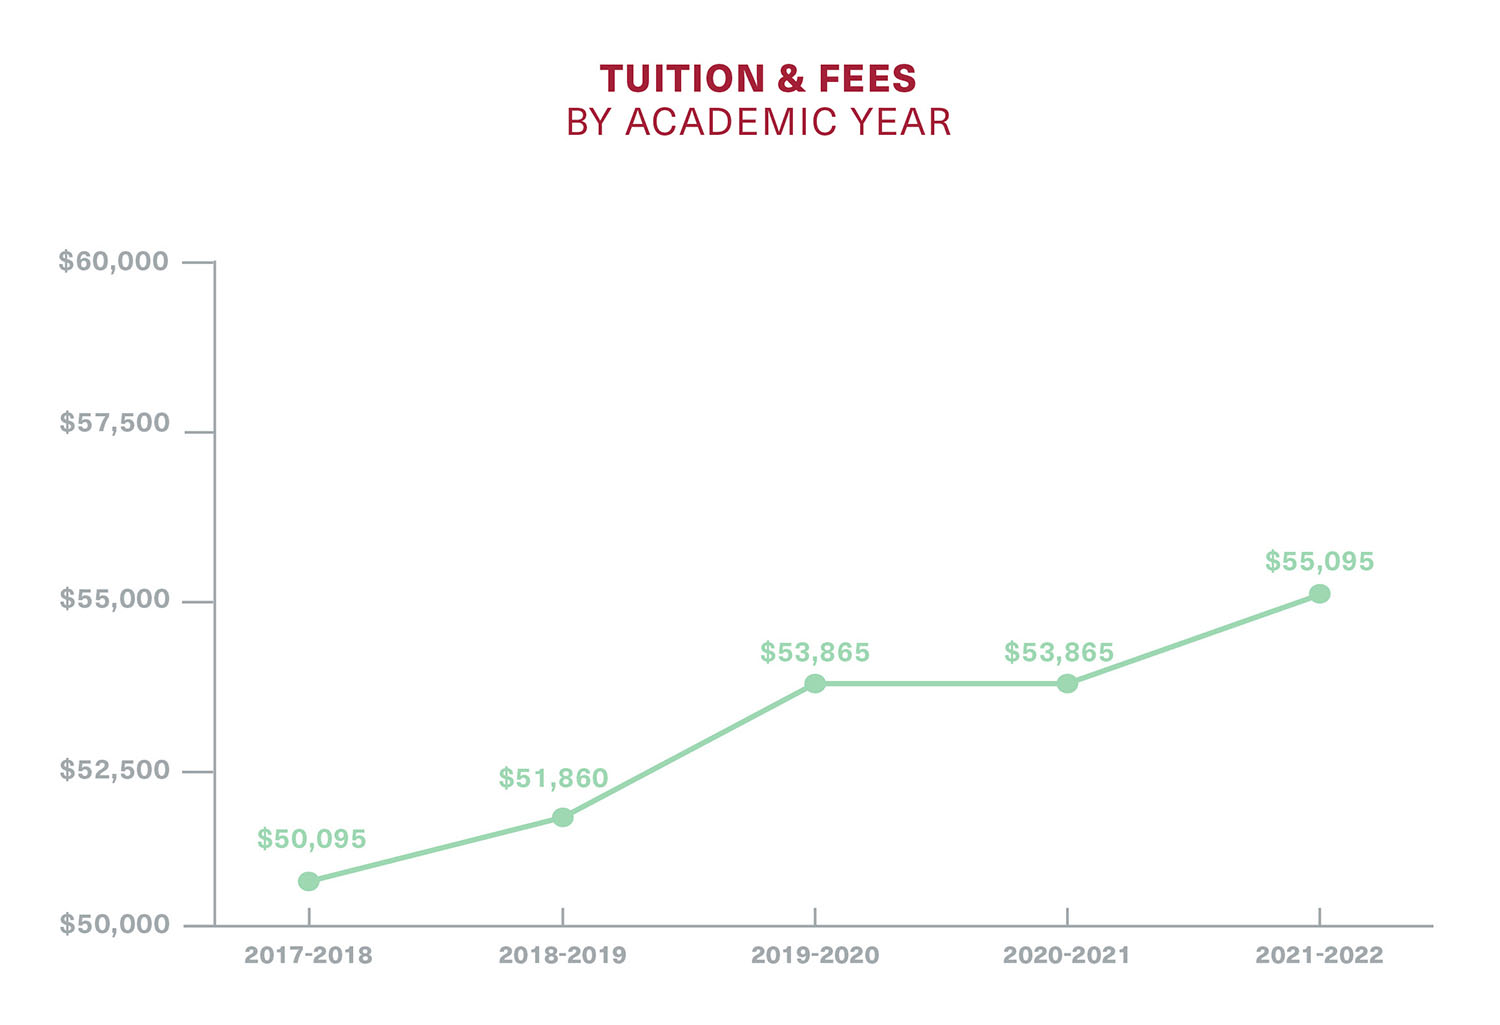
For more detailed information refer to the Sourcebook.

Muhlenberg College Muhlenberg College Logo
Muhlenberg College 2400 Chew St.
Allentown, PA 18104
484-664-3100
  • Maps & Directions
  • Accessibility
  • Library
  • Title IX
  • Employment
  • Conferences & Events
  • Diversity & Inclusion
  • Weather Update
  • Annual Security & Fire Safety Report
  • 'Berg Outfitters

Social

Facebook
Instagram
X/Twitter
YouTube
LinkedIn

© Muhlenberg College

Muhlenburg College
  • Who We Are
    • Mission
    • History
    • Leadership
    • Academics
    • College Life
    • Campus Map
    • Life in the Lehigh Valley
  • Admissions & Aid
    • Explore Your Visit Options
    • How To Apply
    • Scholarships & Financial Aid
    • Transfer Students
    • International Students
    • Continuing Studies
    • Graduate Studies
    • Tuition and Fees
    • First-Year Experience
  • Academics
    • Majors, Minors & Certifications
    • Adult Accelerated & Evening Programs
    • Summer Study
    • Graduate Programs
    • Preprofessional Programs
    • Experiential Learning
    • Honors Programs
    • Global Education
    • Our Faculty
    • Your Coaching Team
  • Student Life
    • Housing
    • Dining
    • Getting Involved
    • Athletics
    • Student Services
    • Health & Wellness
    • Religious & Spiritual Life
  • Powerful Outcomes
    • The Career Center
    • Fellowships & Postgraduate Awards
  • Visit
  • Apply
  • Request Info
  • Give

Info For:

  • Current Students
  • Alumni & Friends
  • Faculty & Staff
  • Parents
  • News
  • Calendar
  • Athletics
  • Arts
  •  
  •  
  •  
Boundless The Campaign For Muhlenberg